In October 2026, three S&P 500 ETFs account for most of the PEA market: the Amundi PEA S&P 500 (PSP5) at 0.12% fees, the BNP Paribas Easy S&P 500 (ESE) at 0.14%, the largest, and since June 2025 the iShares S&P 500 Swap PEA (SPEA) at 0.10%, the cheapest. For a new PEA, my choice is the PSP5. But I will also tell you why, in my own PEA, I preferred a World ETF, which already contains around 71% S&P 500.
In this guide, I compare all the S&P 500 ETFs available in a PEA on their fees, size, counterparty and real performance, measured on market prices since June 2025. I also cover the composition and rules of the S&P 500, how it differs from the Nasdaq-100, nearly 13 years of performance in euros, the S&P 500 or World question, the cheapest brokers for buying these ETFs, and tax.
This article is not sponsored. Some links are affiliate links: if you open your account with Interactive Brokers through my link, you can receive up to $1,000 in IBKR shares ($1 for every $100 deposited in the first year), and with Saxo, up to €500 in free brokerage fees.
🏆 The best S&P 500 ETF for a PEA at a glance
🥇 My choice Amundi PEA S&P 500 (PSP5) S&P 500 · 0.12% per year · €60.98 per share
| 🥈 The largest BNP Paribas Easy S&P 500 (ESE) S&P 500 · 0.14% per year · €35.15 per share
| 💶 The cheapest iShares S&P 500 Swap PEA (SPEA) S&P 500 · 0.10% per year · €6.73 per share
|
All three track the same index and their results are almost identical: since 16 June 2025, €10,000 has grown to around €13,420 in each, give or take a few euros. So the choice comes down to size, liquidity and the price at your broker. To compare the brokers themselves, my PEA comparison puts the 16 main offers on the market side by side.
📹 My video: which is the best S&P 500 ETF for a PEA?
If you prefer video, here is my comparison of the PEA S&P 500 ETFs, filmed when the iShares SPEA arrived in June 2025. This article updates it with sixteen months of hindsight on real performance.
📊 Comparison of PEA-eligible S&P 500 ETFs
Here are the three S&P 500 ETFs that matter in a PEA, with official issuer data and closing prices on 27 October 2026. All three are accumulating (dividends are reinvested automatically, with no fees or tax), unhedged against the dollar and use synthetic replication, the only way to get American shares into a PEA.
Criterion | PSP5 | ESE | SPEA |
|---|---|---|---|
Name | Amundi PEA S&P 500 UCITS ETF Acc | BNP Paribas Easy S&P 500 UCITS ETF EUR C | iShares S&P 500 Swap PEA UCITS ETF |
Issuer | Amundi 🇫🇷 | BNP Paribas AM 🇫🇷 | BlackRock (iShares) 🇺🇸 |
Ongoing charges | 0.12% | 0.14% | 0.10% |
Assets | €1.56bn (fund) | €3.77bn (euro share class) | €59m |
Launched | May 2014 | September 2013 | May 2025 |
Domicile | 🇫🇷 France | 🇫🇷 France | 🇮🇪 Ireland |
Swap counterparty | Société Générale | Six banks (BNP Paribas, Goldman Sachs, Morgan Stanley…) | Not published |
Share price | €60.98 | €35.15 | €6.73 |
12-month performance | +18.54% | +18.44% | +18.43% |
Gap to the index over 1 year (official reports) | −0.10 point (at 26/10/2026) | −0.18 point (at 30/09/2026) | −0.02 point (at 30/09/2026) |
Daily trading volume (3 months) | €2.7m | €4.4m | €0.8m |
ISIN | FR0011871128 | FR0011550185 | IE000DQLYVB9 |
Other S&P 500 ETFs exist in the PEA, but I do not choose them as a main holding:
ETF | Ticker | Fees | Why not as a main holding |
|---|---|---|---|
Amundi PEA S&P 500 EUR Hedged | PSPH | 0.12% | Hedged against the dollar: +14.7% in 2025 when the dollar fell, but +10.9% over 12 months against +18.5% for the PSP5 when it rose again. A bet on the currency, not a long-term investment |
BNP Paribas Easy S&P 500 EUR H | ESEH | 0.14% | Same hedging logic as the PSPH, at BNP Paribas |
Amundi PEA S&P 500 Screened | PE500 | 0.25% | Tracks a filtered index (316 companies): double the fees and a larger gap to its own index (−0.7 point over one year at 26/10/2026) |
Amundi PEA S&P 500 Screened S | PSPS | 0.25% | Same filtered fund, a share class at around €7 launched in June 2025, still very thinly traded |
Amundi PEA S&P 500 Screened EUR Hedged | P500H | 0.28% | Filtered and hedged in euros: the most expensive of the family |
In October 2026 there is no leveraged S&P 500 ETF eligible for the PEA: the closest is the Amundi MSCI USA Daily (2x) (CL2, 0.50% fees), which tracks a broader American index with daily leverage. It is a speculative product, not a core portfolio holding.
🔬 Advertised fees or real performance: what the numbers say
Advertised fees do not tell the whole story: what matters is what the ETF really earns you compared with the index it tracks. So I compared the closing prices of the three ETFs over the same periods. As they all track the same index, the gap between them is exactly what you gain or lose by choosing one over another.
Period | PSP5 | ESE | SPEA |
|---|---|---|---|
Since 16 June 2025 (first SPEA prices) | +34.23% | +34.16% | +34.22% |
Over 12 months | +18.54% | +18.44% | +18.43% |
Since 1 January 2026 | +18.96% | +18.87% | +18.89% |
Year 2025 | +3.67% | +3.58% | Not yet launched on 1 January |
Year 2024 | +33.82% | +33.68% | Not yet launched |
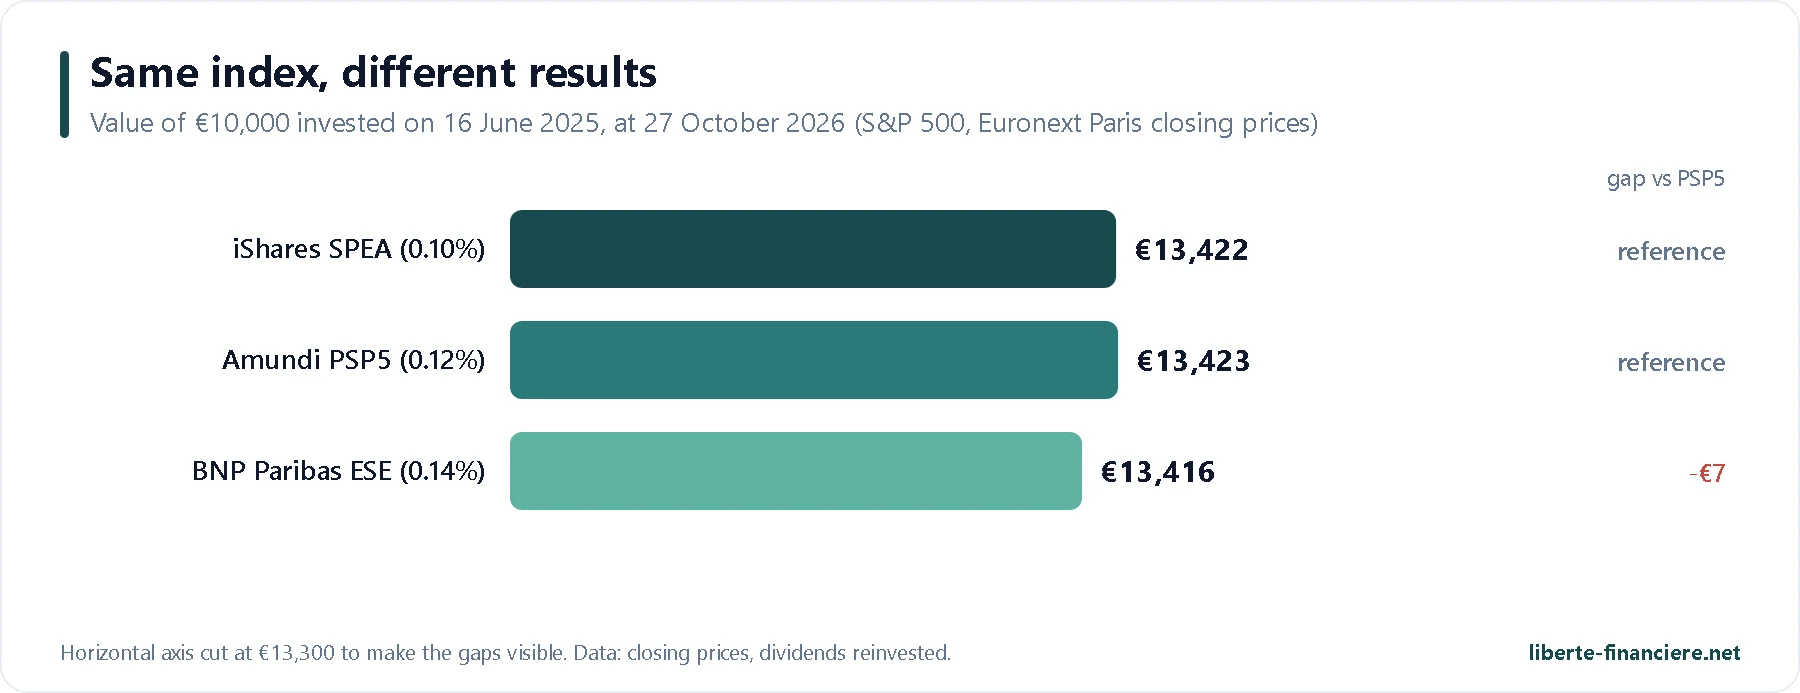
Three takeaways. First, the gaps are tiny: less than a tenth of a point between the three since June 2025, or a few euros on €10,000. Second, the official reports confirm the ranking: over one year, the SPEA came in 0.02 point below the S&P 500 at 30 September 2026, the ESE 0.18 point below, and the PSP5 0.10 point below at 26 October. Finally, over the long term, the PSP5 has beaten its index by 0.28 point per year over ten years, thanks to the swap (see below): that track record, which the SPEA does not have yet, is what makes me prefer it.
🔎 The PEA S&P 500 ETFs in detail
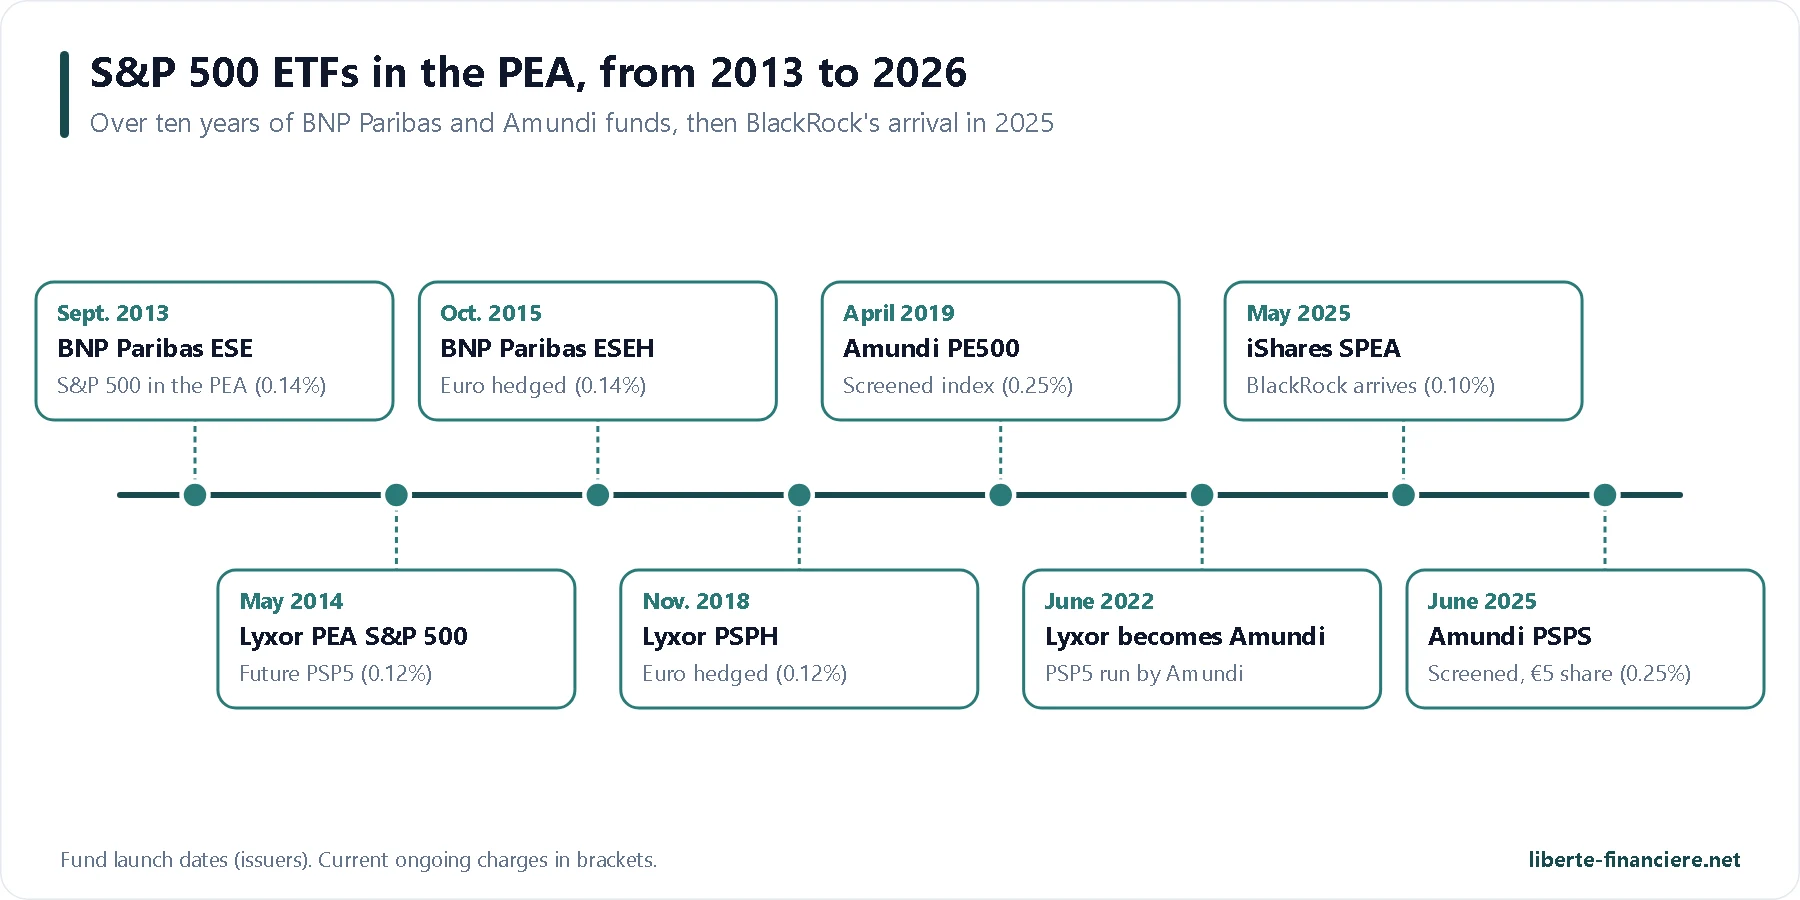
For more than ten years, BNP Paribas and Amundi (formerly Lyxor) shared the PEA's S&P 500 market between them. BlackRock's arrival in 2025 put fresh pressure on fees:
Amundi PEA S&P 500 (PSP5): my choice
Launched in May 2014 by Lyxor as the Lyxor PEA S&P 500, and managed by Amundi since 1 June 2022, the PSP5 is the PEA S&P 500 ETF with the longest published record of management quality. Its real fees are 0.12% per year, and the fund holds more than €1.5 billion. Above all, over ten years it has done better than its benchmark: 14.95% per year against 14.67% at 26 October 2026, or a cumulative rise of 303% against 293%. Its swap is with Société Générale, and its shares trade at around €61.
Pros: 0.12% fees, 12 years of history above its index, solid assets, and free purchases at Fortuneo (from €500 to €100,000) until 31 December 2026.
Cons: a share price of around €61, less flexible than the SPEA for small monthly payments; a single counterparty bank.
Who it's for: most investors, especially with a broker that does not charge for Amundi ETFs.
Buy the PSP5 in your PEA At Interactive Brokers, a €500 ETF order costs €2.50 (the PEA legal cap). Bonus: up to $1,000 in IBKR shares. |
BNP Paribas Easy S&P 500 (ESE): the largest
The BNP Paribas Easy S&P 500 (ESE) is the oldest of the PEA S&P 500 ETFs, launched in September 2013, and by far the largest: €3.77 billion for its euro share class alone, more than €9 billion for the fund as a whole. It is also the most traded in Paris, with an average of €4.4 million a day over three months. Its fees are slightly higher (0.14%) and it lagged its index by 0.18 point over one year at 30 September 2026. What makes it different: its swap is spread across six major banks (BNP Paribas, BofA, Citigroup, Goldman Sachs, Morgan Stanley and Société Générale), which dilutes counterparty risk.
Pros: the largest and most traded, a swap spread across six banks, thirteen years of history.
Cons: the highest fees of the three (0.14%), a slight lag behind its index over one year, no free brokerage offer found.
Who it's for: those who want maximum liquidity, or who want to spread their savings across two issuers.
Buy the ESE in your PEA Available at Interactive Brokers at the same rate as the other ETFs, on all European exchanges. |
iShares S&P 500 Swap PEA (SPEA): the cheapest
Listed in Paris on 4 June 2025, the iShares S&P 500 Swap PEA (SPEA) is BlackRock's answer to the French ETFs, just as the WPEA was for the MSCI World. It is the cheapest on the market (0.10% per year) and the one that has tracked its index most closely over one year (−0.02 point at 30 September 2026). Its share price of under €7 lets you invest almost to the euro each month. It has two weaknesses: assets that are still modest (€59 million, compared with the billions of the PSP5 and ESE) and irregular trading (a median of €0.28m a day), which calls for limit orders. BlackRock does not publish the names of its counterparty banks.
Pros: 0.10% fees, the best index tracking over one year, a share price under €7 that is ideal for investing each month.
Cons: less than a year and a half of existence, €59m in assets, low trading volume and an unpublished counterparty.
Who it's for: investors with a long horizon who accept a fund that is still young, or who want to diversify their issuers.
🧭 What exactly is the S&P 500?
The S&P 500 is the index of the 500 largest listed companies in the United States, created in 1957 and calculated by S&P Dow Jones Indices. It had 503 holdings at 30 September 2026 (some companies, such as Alphabet, have two classes of shares) and covers 75 to 80% of American stock market value, depending on the issuer. An S&P 500 ETF makes you a shareholder, proportionally, of Nvidia, Apple, Microsoft, Amazon, JPMorgan, Eli Lilly and Coca-Cola, for a few hundredths of a percent in fees per year.
Criterion | S&P 500 (at 30/09/2026) |
|---|---|
Holdings | 503 |
Countries | 🇺🇸 United States only |
Share of the top 10 holdings | 39.06% |
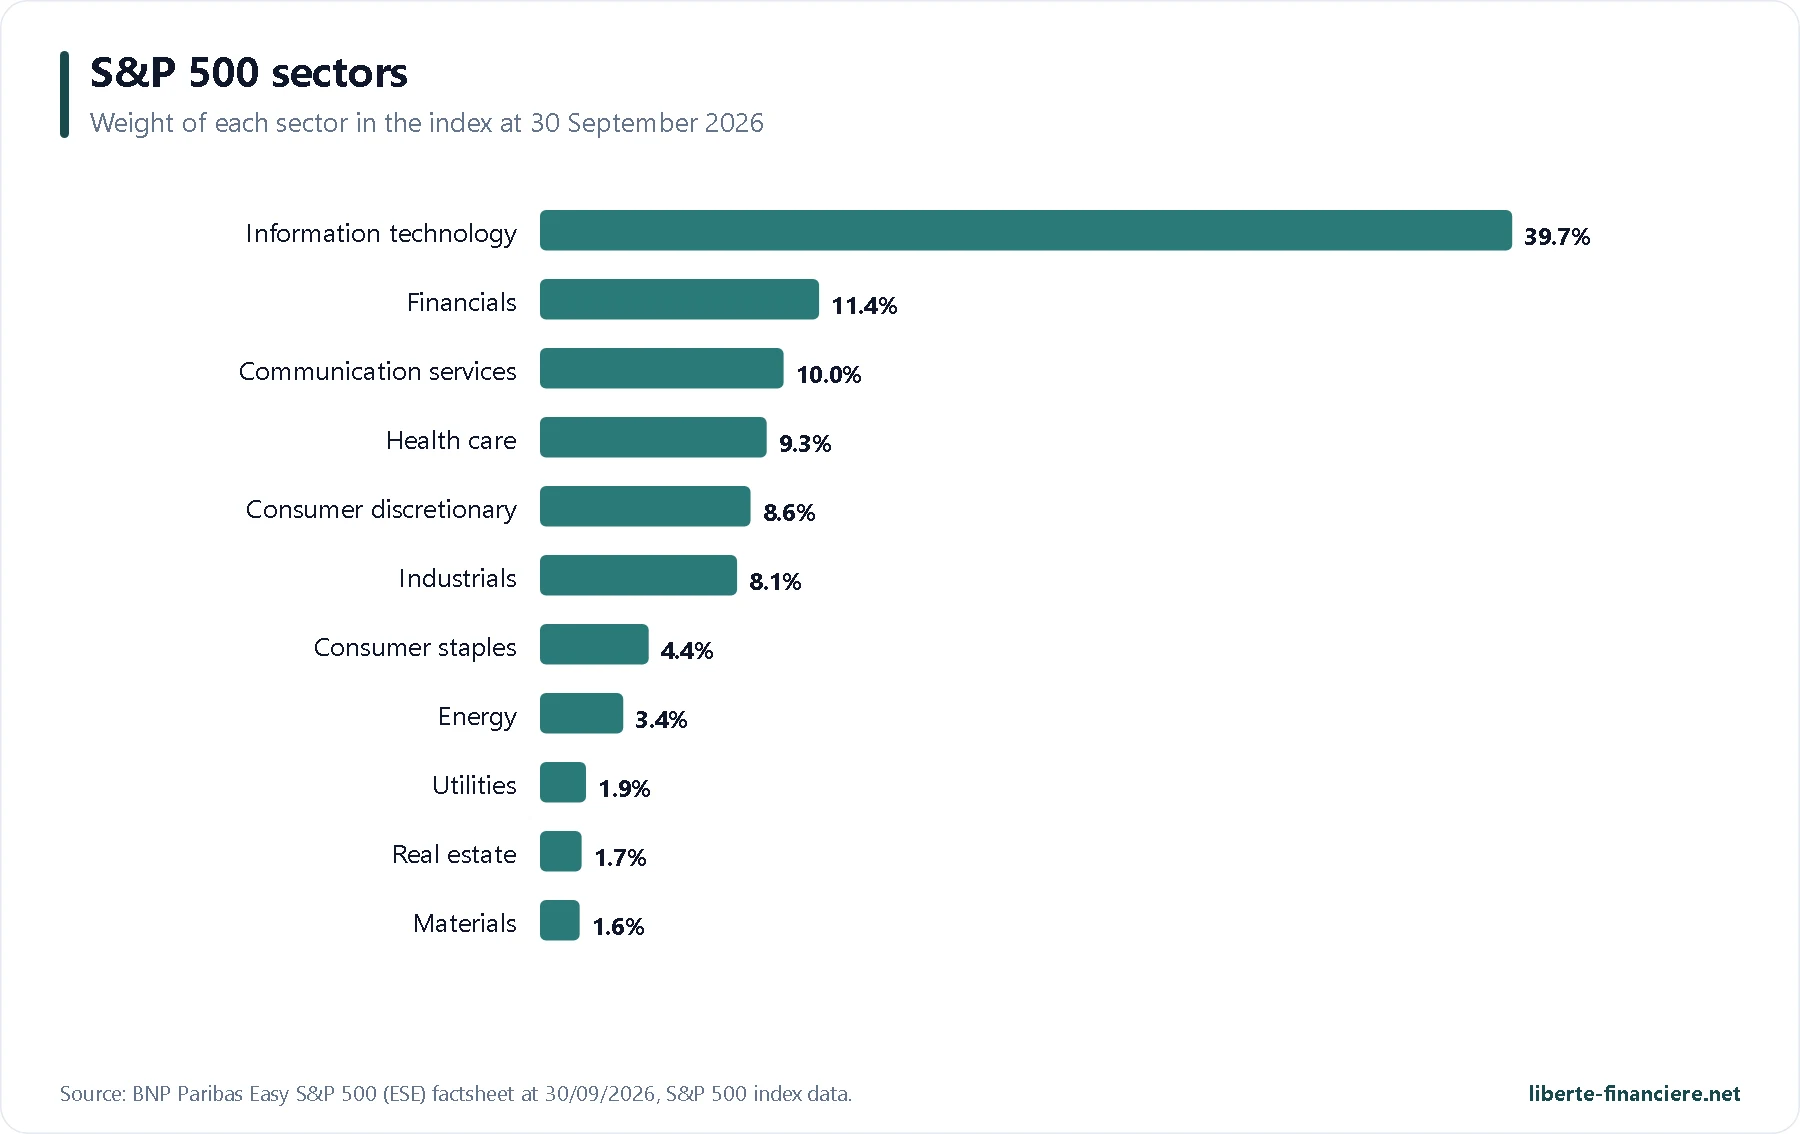
Information technology | 39.71% |
Dividend yield | 1.1% |
Price/earnings ratio | 24.7 times |
1-year performance in € (at 30/09/2026) | +19.31% |
10-year performance, per year, in € (at 26/10/2026) | 14.67% |
10-year performance, per year, in $ (at 30/09/2026) | 14.76% |
The top 10 companies of the S&P 500
Rank | Company | Weight |
|---|---|---|
1 | Nvidia | 8.38% |
2 | Apple | 7.37% |
3 | Microsoft | 5.78% |
4 | Amazon | 3.71% |
5 | Alphabet (Google), class A share | 3.06% |
6 | Broadcom | 2.53% |
7 | Alphabet (Google), class C share | 2.46% |
8 | Meta (Facebook) | 2.43% |
9 | Micron Technology | 1.82% |
10 | Tesla | 1.52% |
These ten holdings make up 39% of the index at 30 September 2026 (BNP Paribas Easy S&P 500 factsheet), and Nvidia alone more than 8%. Adding communication services, Amazon and Tesla, technology-related companies represent more than half of the S&P 500: that has been its strength for fifteen years, and it is its main weak point.
How the index is built
A committee, not a simple ranking: additions and removals are decided by the index committee of S&P Dow Jones Indices, which applies public rules.
Size: to join, a company must have a stock market value of at least $22.7 billion (threshold raised on 1 July 2025), with at least 10% of its shares actually tradable.
Earnings: it must be profitable over the latest quarter and over the sum of the last four quarters. This is a quality filter that the MSCI World does not apply.
Seasoning: a newly listed company must wait 12 months before joining. On 4 June 2026, S&P DJI refused any exception for newly listed giants: that is why SpaceX, which has joined the Nasdaq-100, is not in the S&P 500.
Weighting and reviews: each company is weighted by its free-float market capitalisation, and the index is rebalanced every quarter (Bloom Energy, Illumina and Everpure joined on 21 September 2026).
S&P 500 or Nasdaq-100?
S&P 500 | Nasdaq-100 | |
|---|---|---|
Number of holdings | 503 | 101 |
Information technology | 38.2% | 57.9% |
10-year performance in € (cumulative) | +293% | +525% |
Year 2022 in € | −13.2% | −28.1% |
PEA ETF (Amundi) | PSP5, 0.12% | PANX, 0.30% |
The Nasdaq-100 has done far better over ten years, but it is a much more concentrated bet: 101 companies, nearly 58% of them in technology, no banks, and sharper falls (−28% in 2022 in euros, against −13% for the S&P 500). For an investor who wants a core holding, the S&P 500 is the diversified version of America; the Nasdaq-100 is a conviction position.
🌍 S&P 500 or MSCI World: do you really need an S&P 500 ETF?
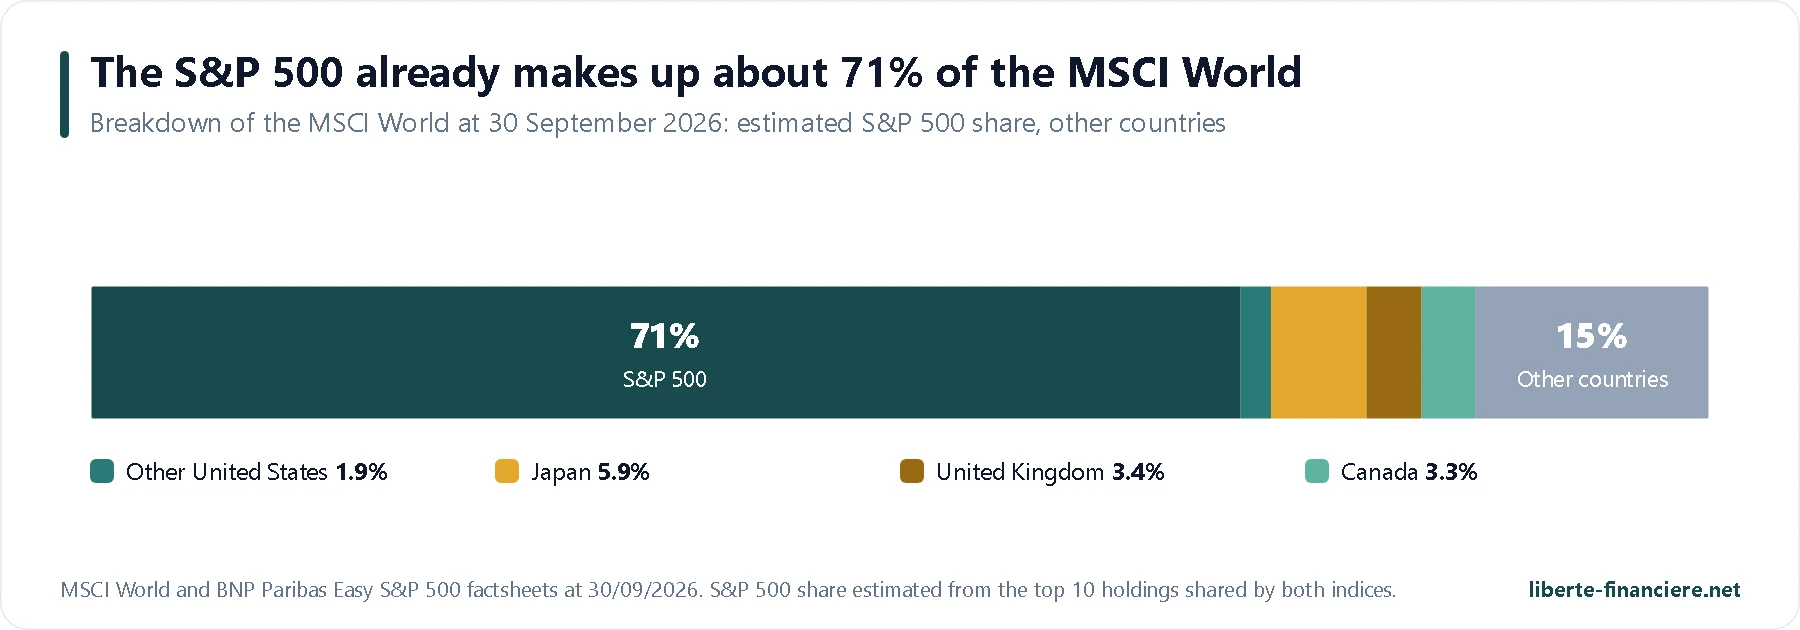
This is the question to ask before choosing an S&P 500 ETF: do you really need one? An MSCI World ETF already holds the United States at 72.9% (MSCI factsheet at 30 September 2026), and its top ten holdings are exactly the same ten companies as those of the S&P 500: Nvidia, Apple, Microsoft, Amazon, Alphabet (twice), Meta, Broadcom, Micron and Tesla. They make up 27.9% of the World and 39.1% of the S&P 500. Comparing these two figures, we can estimate that the S&P 500 represents around 71% of the MSCI World.
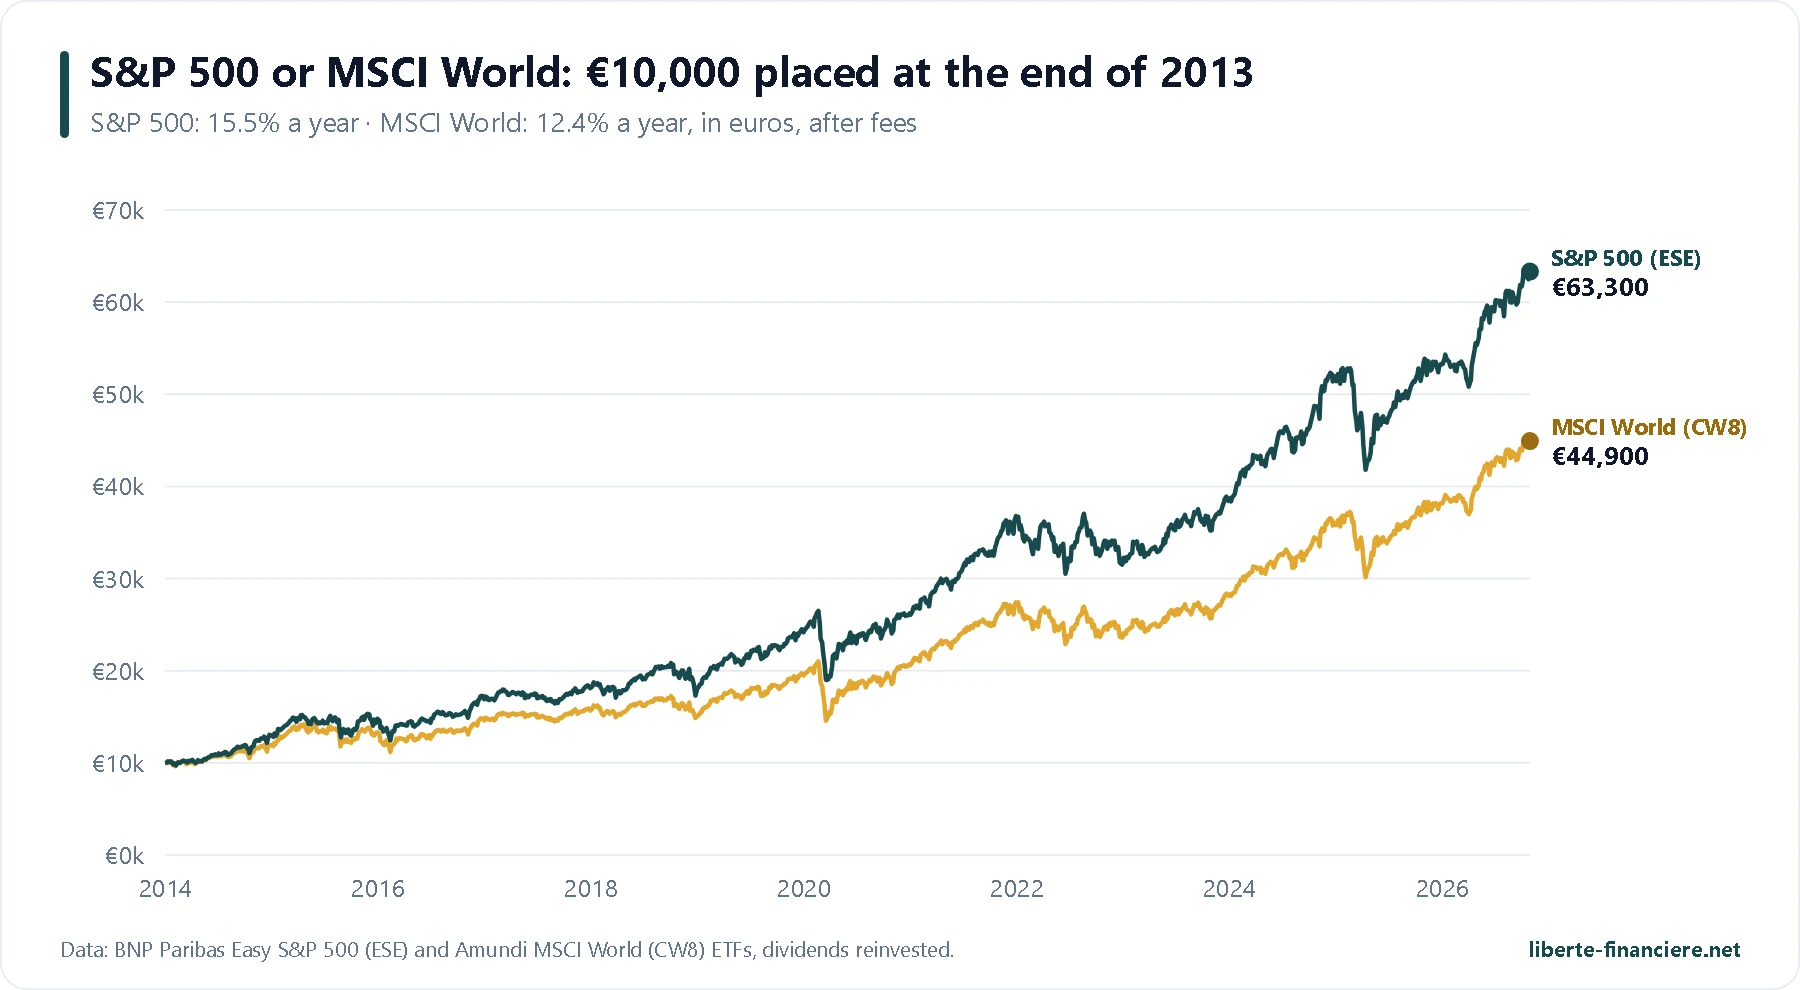
Over the last twelve years, the S&P 500 has clearly won: €10,000 invested at the end of 2013 in a PEA S&P 500 ETF is worth around €63,300, against €44,900 in an MSCI World ETF, or 15.5% per year against 12.4%. But this is not a rule: in 2025, the World returned +6.6% in euros and the S&P 500 only +3.7%, and over 2000-2009 American shares did worse than the rest of the world. Recent American outperformance owes a great deal to a handful of technology giants.
I compared the two indices in more detail in this video:
S&P 500 or World: my view by investor profile
You want a single ETF for life: the World (or the ACWI) is more diversified and already contains most of the S&P 500. That is my choice.
You believe in the lasting dominance of American companies: the S&P 500 alone is defensible, provided you accept the concentration in one country and in technology.
You already have a World ETF: adding an S&P 500 diversifies nothing, it only increases your exposure to the United States. If you want to complement it, look at emerging markets or Europe instead.
You want to reduce your share of the United States: neither; combine a Europe or emerging markets ETF with your World ETF.
To choose your World ETF, everything is in my guide to the best World ETF for a PEA.
🔄 How can an S&P 500 ETF get into a PEA?
The PEA is reserved for European shares: a fund is only admitted if it permanently holds at least 75% in shares of companies from the European Union or the European Economic Area. An ETF that actually bought Apple or Nvidia would be excluded. So the PEA S&P 500 ETFs use synthetic replication: they buy a basket of European shares (Adyen, Siemens Energy, Bayer, DHL… for the SPEA) and exchange it with a bank, through a swap contract, for the performance of the S&P 500.
The specific risk of this structure is the default of the counterparty bank: European fund regulation (UCITS) limits what it can owe the ETF to 10% of its assets, and the fund keeps its basket of European shares. So the risk is real but limited. The ESE reduces it further by spreading its swap across six banks. I have explained the mechanism, and the 2026 debate about the future of these ETFs in the PEA (ruled out by the government on 26 August 2026), in my guide to the best World ETF for a PEA.
The swap has a little-known advantage: the benchmark assumes that American dividends are taxed at 30%, whereas a well-structured fund pays less. The counterparty bank sometimes shares this gain, which explains why a well-managed synthetic ETF can beat its index despite its fees, as the PSP5 has over ten years (+0.28 point per year).
📈 What a PEA S&P 500 ETF has returned since 2014
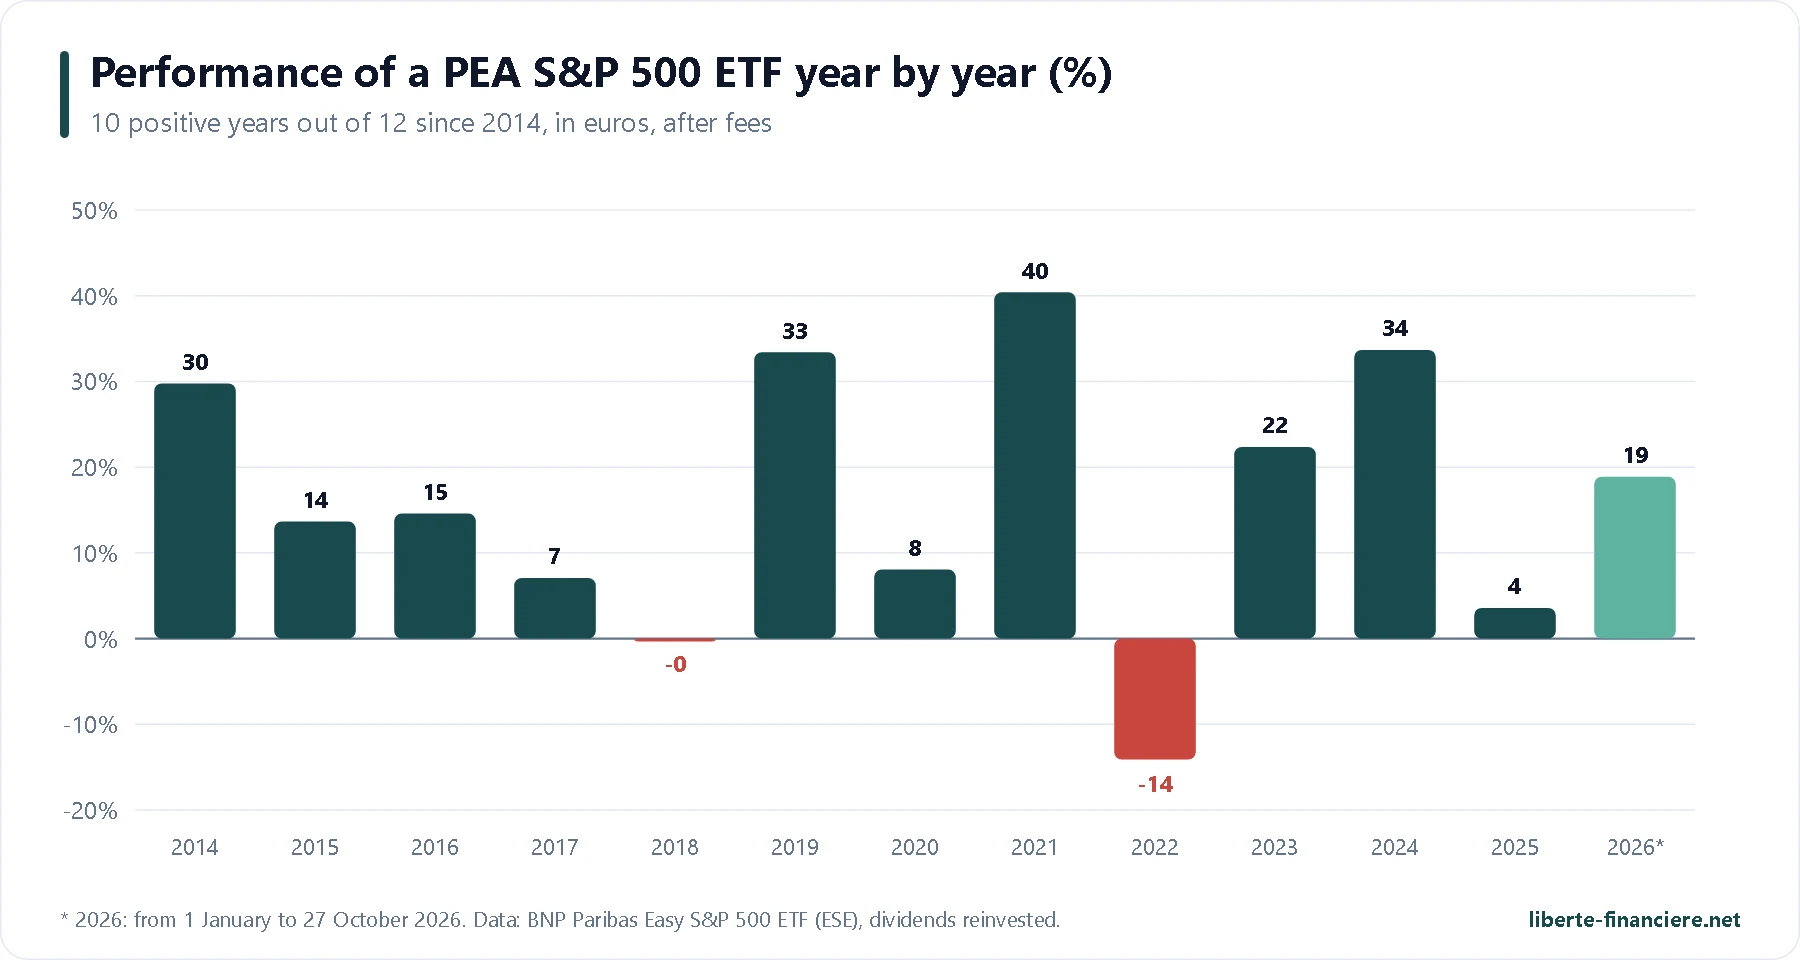
To measure what a French investor has really earned, I used the daily prices of the ESE, the oldest PEA S&P 500 ETF (dividends reinvested, fees deducted, in euros). €10,000 invested at the end of 2013 is worth around €63,300 on 27 October 2026, or 15.5% per year for nearly 13 years.
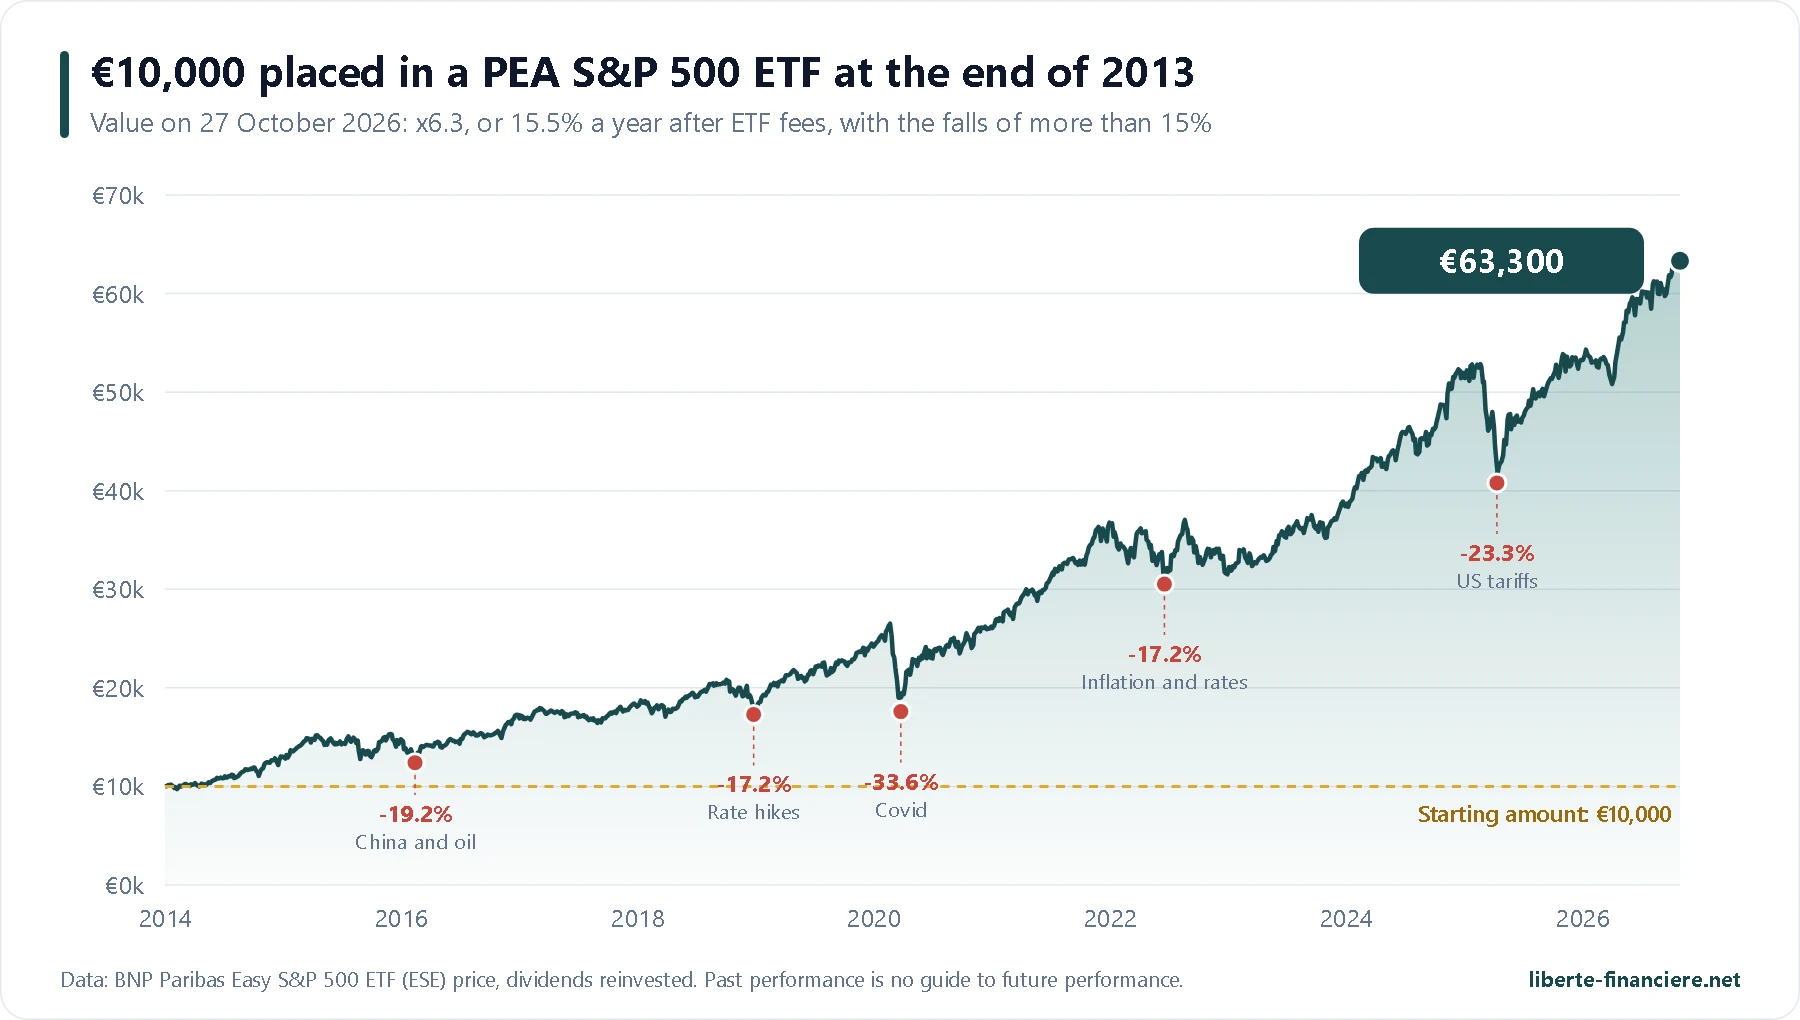
This result was achieved through five falls of more than 15%, all of them recovered:
Crisis | Maximum fall (in €) | Peak to trough | Back to the peak |
|---|---|---|---|
China, oil and the dollar (2015-2016) | −19.2% | December 2015 to February 2016 | July 2016 (7 months) |
US interest rate rises (late 2018) | −17.2% | October to December 2018 | April 2019 (6 months) |
Covid (2020) | −33.6% | 19 February to 23 March 2020 | January 2021 (11 months) |
Inflation and rising rates (2022) | −17.2% | January to June 2022 | July 2023 (a year and a half) |
US tariffs (2025) | −23.3% | 19 February to 9 April 2025 | October 2025 (8 months) |
These thirteen years have been exceptional, driven by the American technology giants. The S&P 500 has also been through very difficult periods: it lost around half its value between 2000 and 2002, then more than 50% between 2007 and 2009, and it did not return to its 2000 level for good until 2013 (in dollars, excluding dividends). Over ten years to 30 September 2026, the index returned 14.76% per year in dollars: bear in mind that a pace of 7 to 10% per year is a more cautious assumption for your projections.
And investing €200 every month?
By buying €200 of S&P 500 ETF on the first trading day of every month since January 2014, without ever selling anything, you would have paid in €30,800 and your portfolio would be worth around €87,900 today.
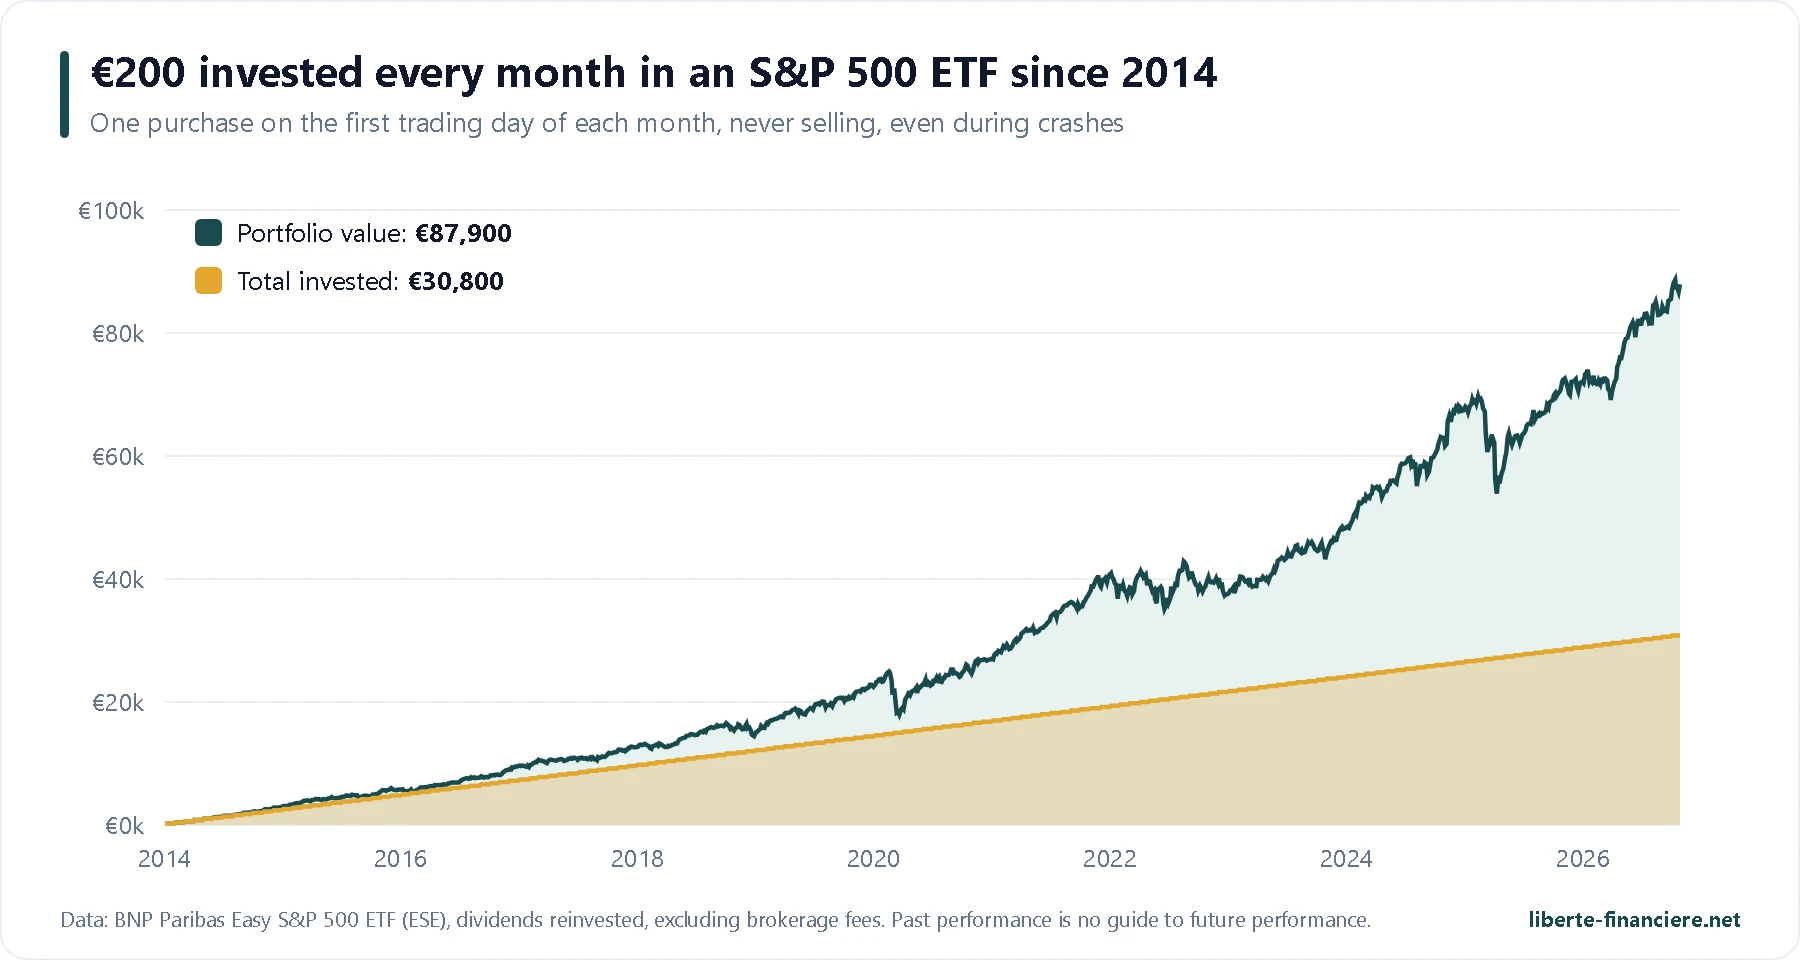
Investing monthly means you do not have to pick the right moment: you buy more shares when prices fall. The purchases of March 2020 and April 2025, in the middle of the panic, are among the most profitable in the simulation.
Invest in an S&P 500 ETF every month Open your PEA with Interactive Brokers: €1 for a €200 purchase, all European exchanges, and up to $1,000 in free IBKR shares. |
🧮 How much can an S&P 500 ETF return over 10, 20 or 50 years?
Serious projections need a much longer period than the ESE's thirteen years. So I used the S&P 500 history published by the economist Robert Shiller (Yale University), with dividends reinvested, in dollars. Over 50 years (September 1976 to September 2026), the index returned 11.8% per year, or 7.9% per year after inflation.
Period (to the end of September 2026) | Annual return | After US inflation |
|---|---|---|
50 years | 11.8% | 7.9% |
30 years | 10.4% | 7.6% |
20 years | 11.2% | 8.5% |
Worst 10-year period since 1950 (1999-2009) | −3.5% | −5.9% |
Worst 20-year period since 1950 | +5.1% (2000-2020) | +0.35% (1962-1982) |
Two lessons. Over the long term, the S&P 500 has always paid off in the end: since 1950, no 20-year period has lost money, even after inflation. But over 10 years, anything can happen: an investor who came in during March 1999 was still losing 3.5% per year ten years later. That is why an S&P 500 ETF only suits money invested for at least 10 to 15 years.
Simulation: €200 a month for 10, 20 or 50 years
Here is what €200 invested every month would become, under three annual return assumptions, before fees and tax:
Return assumption | After 10 years | After 20 years | After 50 years |
|---|---|---|---|
Total paid in | €24,000 | €48,000 | €120,000 |
Cautious (6% per year) | €32,500 | €90,700 | €715,800 |
Average after inflation (7.9%) | €35,800 | €112,500 | €1,377,500 |
Historical 50-year average (11.8%) | €43,900 | €177,900 | €5,639,000 |
And for a single payment of €10,000, with nothing added afterwards:
Return assumption | After 10 years | After 20 years | After 50 years |
|---|---|---|---|
Cautious (6% per year) | €17,900 | €32,100 | €184,200 |
Average after inflation (7.9%) | €21,400 | €45,800 | €447,800 |
Historical 50-year average (11.8%) | €30,500 | €93,100 | €2,643,000 |
The gap between the columns shows the power of compound interest: over 50 years, most of the final capital comes from the gains, not the payments. It also shows how much the assumption matters: between 6% and 11.8% per year, the final capital from monthly payments is multiplied by nearly eight over 50 years. I use the cautious assumption for my own projections. These simulations do not include fees, tax or currency effects, and are no guide to future performance.
🏦 Where to buy an S&P 500 ETF in a PEA?
Your choice of broker matters as much as your choice of ETF: a €2 order fee on a €200 purchase costs 1%, eight times the PSP5's annual fees. Here are the offers I prefer, with fees checked against the official price lists in October 2026:
Broker | €200 order | €1,000 order | S&P 500 ETF at €0 | Bonus |
|---|---|---|---|---|
€1.00 | €2.55 | No (0.05% commission plus exchange fees) | ||
€1.00 | €2.00 | Offer on more than 200 Amundi ETFs until 31/12/2026 | ||
€0 (first order of the month) | €0 on the PSP5 | PSP5, PSPH, PE500 and P500H: free purchases from €500 to €100,000 until 31/12/2026 | ||
€1.00 | €5.00 | Free purchases of Amundi ETFs (Boursomarkets) | ||
€1.00 | €1.00 | Free savings plans, in whole shares |
Fees for an ETF purchase order on Euronext Paris in a PEA, standard price lists in October 2026, including the legal cap of 0.5% of the amount. No free offer was found for the ESE or the SPEA.
How do you read this table? If you choose the PSP5, Fortuneo is unbeatable until the end of 2026 (an offer funded by Amundi, which may end it or change its list), followed by BoursoBank. For the ESE or the SPEA, Trade Republic remains the cheapest per order. Interactive Brokers is the one I prefer if you want a single broker for your PEA and your securities account, with every stock exchange in the world and a share bonus when you open your account.
My preferred broker for an S&P 500 ETF Interactive Brokers: all European exchanges, a PEA with no custody fees, and up to $1,000 in free IBKR shares. |
To compare all the other criteria, see my PEA comparison, as well as the Interactive Brokers bonus code and Saxo bonus code pages.
🧾 Buying an S&P 500 ETF with Interactive Brokers, step by step
Open your account online through the Interactive Brokers link on this page (about 15 minutes, then 1 to 3 days for approval).
Request your PEA from your client area by adding an account. It is reserved for adult French tax residents, one per person.
Choose your pricing plan: the "tiered" plan for orders up to about €3,400, the "fixed" plan above that.
Make a transfer in euros to your PEA from a bank account in your name.
Search for the ETF by its ticker (PSP5, ESE or SPEA) and check the ISIN and the euro listing on Euronext Paris.
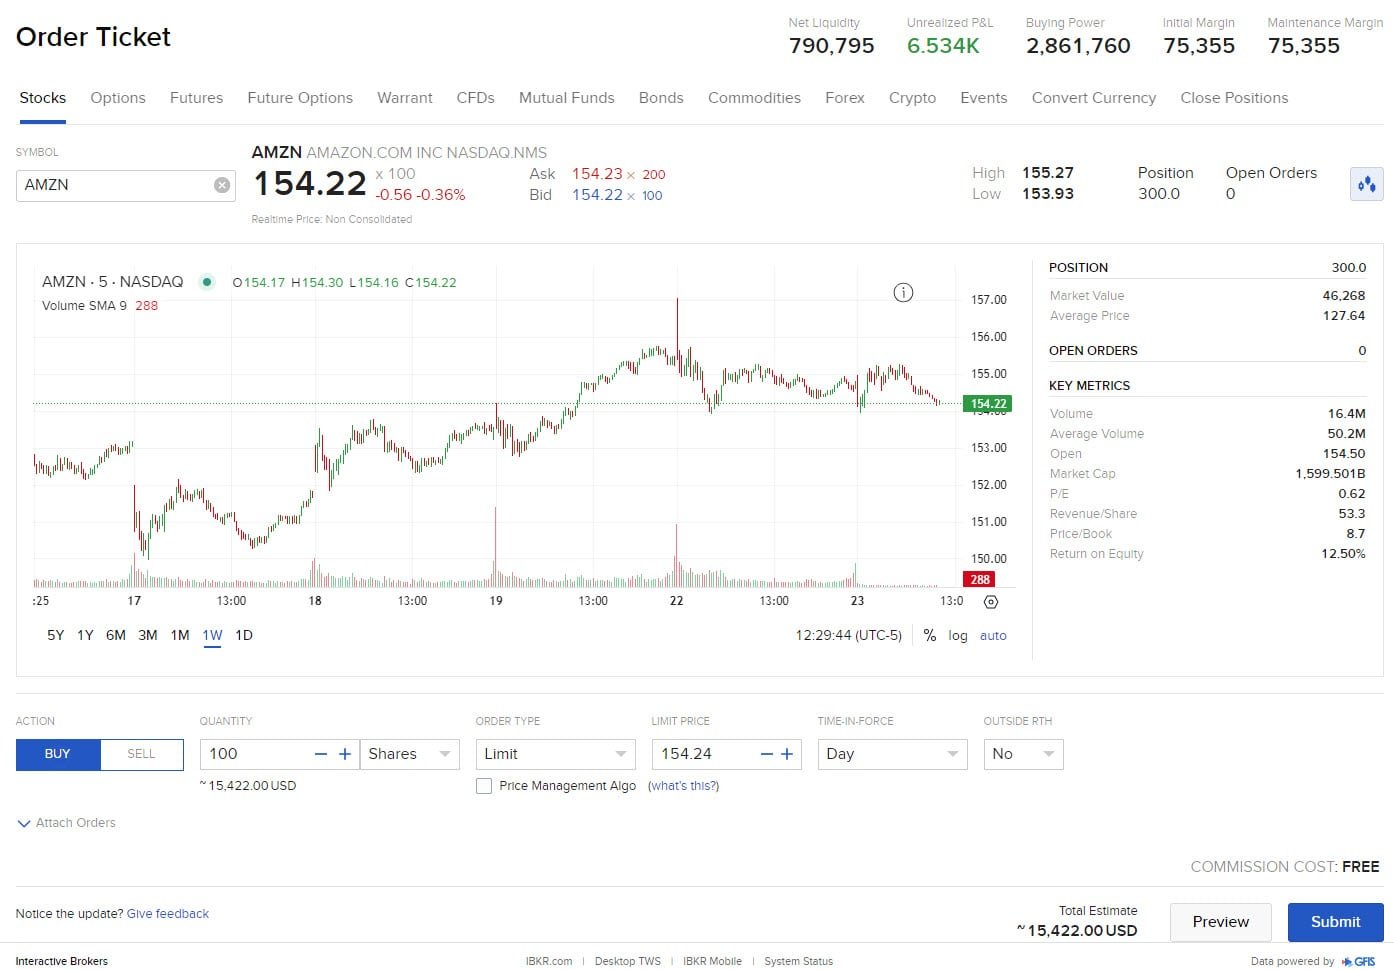
Place a limit buy order for a whole number of shares, with a limit close to the last price, preferably between 9:30 am and 5 pm.
Repeat every month: as the PEA does not accept fractions, Interactive Brokers' automatic investing does not work there, as far as I know.
Interactive Brokers charges no opening fees or custody fees on its PEA, and provides a single tax form (IFU) every year. As the account is held in Ireland, you must declare it on form 3916. All the details are on my Interactive Brokers bonus code page.
🔎 My choice: the World rather than the S&P 500
I do not hold an S&P 500 ETF in my PEA, and that is a deliberate choice. My PEA is with Saxo, and between December 2025 and July 2026 I built a position there in an MSCI World ETF, the iShares WPEA, with 8 purchases totalling €23,489. On 27 October 2026, my 3,697 shares are worth around €26,660, or +€3,166 (+13.5%).
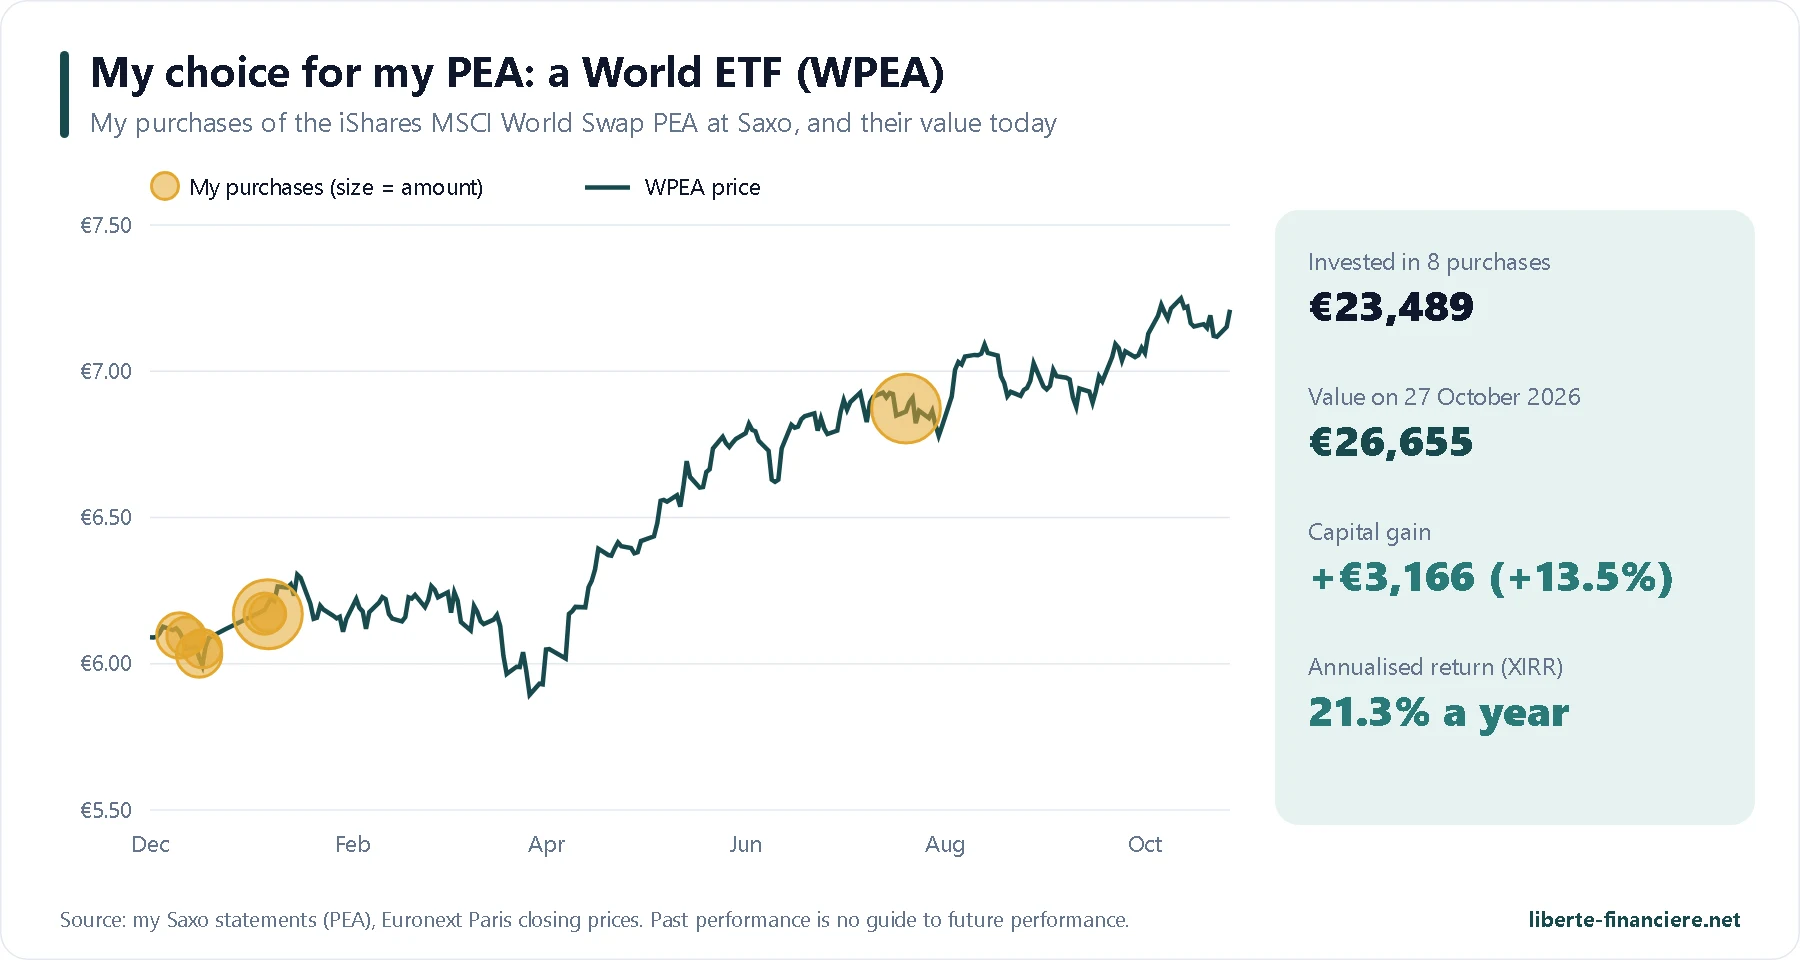
Why the World? Because it already contains around 71% S&P 500, and adds Japan, Europe, the United Kingdom, Canada and Australia for almost the same price. I prefer not to bet everything on one country, even if it has been the most dynamic in the world for fifteen years: its top ten companies make up 28% of the World against 39% of the S&P 500. Over the last 12 months, the gap between the two is small in any case (+18.1% for the WPEA against +18.5% for the PSP5), and in 2025 the World actually did better. My annualised return of 21.3% over ten months mainly reflects a very good year on the stock market: I do not extrapolate it.
That said, it depends on each person: if you are convinced by American companies and concentration does not scare you, an S&P 500 ETF on its own is a perfectly defensible choice. What you should avoid is stacking the two and thinking you are diversifying.
⚠️ The risks to know
As a reminder: I am not a financial adviser. All investment carries a risk of capital loss, and past performance is no guide to future performance.
Capital loss: an S&P 500 ETF follows the American stock market both up and down. It lost 33.6% in one month in 2020 in euros, and the S&P 500 lost more than half its value between 2007 and 2009. Money you need within 5 years has no place here.
Concentration: a single country, and ten companies making up 39% of the index, nearly all linked to technology. A correction in the artificial intelligence giants would hit your ETF directly.
Currency risk: the ETF is listed in euros but its companies are valued in dollars. In 2025, the S&P 500 gained 17.4% in dollars but only 3.5% in euros.
Valuation: at around 25 times earnings, the S&P 500 is expensive compared with its history. This is not a sell signal, but a reason not to extrapolate the 15% per year of the last ten years.
Counterparty and regulatory risk: specific to synthetic PEA ETFs, limited and regulated (see above).
Liquidity: excellent on the ESE and PSP5, weaker on the SPEA: use limit orders.
🧮 Taxes: PEA or securities account for an S&P 500 ETF?
The PEA is the ideal wrapper for an S&P 500 ETF: as long as your money stays in the plan, neither reinvested dividends nor switches are taxed. After 5 years, you only pay the French social contributions (prélèvements sociaux), raised to 18.6% since 1 January 2026.
PEA | Securities account | |
|---|---|---|
Gains withdrawn before 5 years | 31.4% (12.8% income tax + 18.6% social contributions) and the plan is closed, with some exceptions | 31.4% on the capital gains of each year in which you sell |
Gains withdrawn after 5 years | 0% income tax, 18.6% social contributions | 31.4% |
Dividends reinvested by an accumulating ETF | No tax | No tax as long as you do not sell |
Switching from one ETF to another | No tax | Capital gain taxed |
Payment ceiling | €150,000 | None |
S&P 500 ETFs available | Synthetic only (PSP5, ESE, SPEA…) | All, including physical ones at 0.03% |
Example: for €10,000 of capital gains withdrawn after 5 years, you pay €1,860 in a PEA, against €3,140 in a securities account. That gap goes far beyond the few hundredths of a point in fees between a synthetic PEA ETF and a physical ETF.
In a PEA held by a French broker, the single tax form (IFU) is enough. For an account held abroad, such as the Interactive Brokers PEA, I use FlashFiscal, a French tool that prepares the forms (3916, 2074, 2047) from your broker's statements. With my link, you get €15 off your first year.
FlashFiscal: €15 off the first year Your declaration of foreign accounts, prepared from your broker's statements. |
PEA, securities account or life insurance (assurance-vie): the comparison in figures
The same S&P 500 ETF does not earn the same amount in each wrapper. I simulated €10,000 at the start then €200 a month for 20 years (€58,000 paid in), with an index growing 8% per year, deducting each wrapper's own fees and then the tax due when everything is withdrawn:
Wrapper | Annual fees | Capital before tax | Tax and contributions | Net in your pocket | Tax applied |
|---|---|---|---|---|---|
PEA (PSP5) | 0.12% | €157,800 | €18,600 | €139,300 | 18.6% social contributions on gains, no income tax after 5 years |
Securities account (physical ETF at 0.03%) | 0.03% | €159,800 | €32,000 | €127,800 | 31.4% flat tax on gains at sale |
Life insurance (assurance-vie) (ETF at 0.12% + 0.5% management fees) | 0.62% | €147,500 | €21,800 | €125,800 | After 8 years: 17.2% social contributions and 7.5% tax on gains above €4,600 (single person) |
The PEA clearly wins: its fees are very low and, since 2026, its gains bear only 18.6% in social contributions after 5 years. The gap with the securities account exceeds €11,500 in this example, for the same index.
Life insurance (assurance-vie) comes last in this example, despite social contributions that have stayed at 17.2% (the 2026 increase does not apply to it) and an annual allowance of €4,600 in gains (€9,200 for a couple): 0.5% in management fees per year for 20 years costs more than these advantages. With lower fees, or withdrawals spread over several years to use the allowance, it can move back ahead of the securities account. Its real strength lies elsewhere: passing on wealth.
The securities account gives access to the cheapest ETFs, but the 31.4% flat tax on gains penalises it. It is useful when the PEA is full (€150,000 of payments) or for investing directly outside Europe.
Simplified simulation: constant return, tax calculated once on exit, with no brokerage fees or currency effects. Tax rules are those of October 2026.
Open a PEA for your S&P 500 ETF Interactive Brokers: a PEA with no custody fees, all European exchanges, and up to $1,000 in free IBKR shares. |
And in a securities account, which S&P 500 ETF?
If your PEA is full, the securities account gives access to the cheapest S&P 500 ETFs in Europe, some of which actually hold the shares. Gains are taxed at each sale, which again is why the accumulating versions are worthwhile:
ETF | Fees | Replication | Good to know |
|---|---|---|---|
State Street SPDR S&P 500 (SPYL / SPY5) | 0.03% | Physical | SPY5 listed in Paris (distributing) |
Amundi Core S&P 500 Swap (SP5C) | 0.05% | Synthetic | Listed in Paris, $34bn |
Invesco S&P 500 (SPXS) | 0.05% | Synthetic | $59bn, has beaten the index over 10 years |
iShares Core S&P 500 (CSPX / SXR8) | 0.07% | Physical | The largest: $158bn |
Vanguard S&P 500 (VUAA / VUSA) | 0.07% | Physical | $89bn for the fund |
A securities account for ETFs from all over the world Interactive Brokers gives access to all these ETFs, with almost free currency exchange. |
❌ Mistakes to avoid
Stacking World and S&P 500 and thinking you are diversifying: the World already contains around 71% S&P 500. Adding an S&P 500 increases your bet on the United States, it does not diversify you.
Adding a Nasdaq on top: World, S&P 500 and Nasdaq means Nvidia, Apple and Microsoft three times over.
Taking a euro-hedged version for the long term: hedging has a cost and turns your investment into a bet on the dollar.
Choosing an ETF on its advertised fees alone: a 0.02 point difference in fees matters less than the size of the fund, its liquidity and its real tracking difference.
Placing market orders on the SPEA: with a median of €0.28m traded per day, use a limit order.
Paying order fees that are too high: at Fortuneo, the PSP5 can be bought for €0 from €500 to €100,000 until the end of 2026.
Selling during a crash: the five falls of more than 15% since 2014 were all recovered in less than two years.
Taking the last ten years as the norm: 15% per year is exceptional. Over decades, count on more like 7 to 10% per year, with years at −20% or worse.
FAQ: S&P 500 ETFs in a PEA
What is the best S&P 500 ETF for a PEA?
Amundi's PSP5 (0.12%) is my first choice: large assets, ten years above its index and free to buy at Fortuneo until the end of 2026. BNP Paribas's ESE (0.14%) is the largest and most traded; iShares's SPEA (0.10%) is the cheapest but still small.
PSP5 or ESE: which one to choose?
Both are excellent. The PSP5 is slightly cheaper and has done slightly better over 12 months (+18.54% against +18.44%); the ESE is larger, more traded and spreads its swap across six banks. Take the one your broker charges least for.
S&P 500 or MSCI World?
The World already contains around 71% S&P 500, plus Japan, Europe, the United Kingdom and Canada. The S&P 500 has done better over the last ten years, the World is more diversified. I chose the World for my PEA, but both are defensible choices.
Should you hold both a World and an S&P 500 ETF?
No, unless you deliberately want to overweight the United States. The two ETFs overlap by more than 70%.
Euro-hedged S&P 500 ETF or not?
For the long term, unhedged. The hedged version removes the dollar effect, both up and down: it did better in 2025, and worse over the last 12 months.
How much do you need to start?
The price of one share: around €7 for the SPEA, €35 for the ESE, €61 for the PSP5. As the PEA does not accept fractions, low-priced shares are handy for investing every month.
What return can you expect from an S&P 500 ETF?
15.5% per year in euros since the end of 2013, an exceptional period. Over several decades, count on more like 7 to 10% per year on average, with years of sharp falls.
Why is SpaceX not in the S&P 500?
Because the S&P 500 requires 12 months of listing and positive earnings, and S&P DJI refused any exception on 4 June 2026. SpaceX has, however, joined the Nasdaq-100.
What happens if Amundi, BNP Paribas or BlackRock goes bankrupt?
An ETF's assets are separate from those of its manager and held by a custodian bank. The real risk is that of the swap counterparty, limited to 10% of assets by regulation.
And in a securities account?
If your PEA is full, physical ETFs cost from 0.03% (State Street SPDR) to 0.07% (iShares, Vanguard), but gains are taxed at 31.4% at each sale.
Conclusion
In 2026, investing in the S&P 500 from a PEA has never been so simple or so cheap. Amundi's PSP5 is my first choice for its balance of fees, size, track record and free purchases at Fortuneo; BNP Paribas's ESE is the strongest alternative in terms of size and liquidity; iShares's SPEA, the cheapest, still needs to grow. But before choosing an S&P 500 ETF, ask yourself whether you would rather have a World ETF, which already contains three quarters of it: that is my choice, so as not to bet everything on one country.
To take action, you can open your PEA with Interactive Brokers and take advantage of the share bonus, or first compare the offers with my PEA comparison.
And as always, never give up!
ETF data at 27 October 2026. Past performance is no guide to future performance.
Add a comment
A question or your own experience to share? Leave a comment: I reply personally.